What Is Wireshark and How Is It Used?

 Few tools are as useful to the IT professional as Wireshark, the go-to network packet capture tool. Wireshark will help you capture network packets and display them at a granular level. Once these packets are broken down, you can use them for real-time or offline analysis. This tool lets you put your network traffic under a microscope, and then filter and drill down into it, zooming in on the root cause of problems, assisting with network analysis and ultimately network security. This free Wireshark tutorial will teach you how to capture, interpret, filter and inspect data packets to effectively troubleshoot.


What Is Wireshark?

Wireshark is a network protocol analyzer, or an application that captures packets from a network connection, such as from your computer to your home office or the internet. Packet is the name given to a discrete unit of data in a typical Ethernet network.

Wireshark is the most often-used packet sniffer in the world. Like any other packet sniffer, Wireshark does three things:

  1. Packet Capture: Wireshark listens to a network connection in real time and then grabs entire streams of traffic – quite possibly tens of thousands of packets at a time.
  2. Filtering: Wireshark is capable of slicing and dicing all of this random live data using filters. By applying a filter, you can obtain just the information you need to see.
  3. Visualization: Wireshark, like any good packet sniffer, allows you to dive right into the very middle of a network packet. It also allows you to visualize entire conversations and network streams.
A screenshot showing a packet capture in Wireshark

Figure 1: Viewing a packet capture in Wireshark

Packet sniffing can be compared to spelunking – going inside a cave and hiking around. Folks who use Wireshark on a network are kind of like those who use flashlights to see what cool things they can find. After all, when using Wireshark on a network connection (or a flashlight in a cave), you’re effectively using a tool to hunt around tunnels and tubes to see what you can see.

What Is Wireshark Used For?

Wireshark has many uses, including troubleshooting networks that have performance issues. Cybersecurity professionals often use Wireshark to trace connections, view the contents of suspect network transactions and identify bursts of network traffic. It’s a major part of any IT pro’s toolkit – and hopefully, the IT pro has the knowledge to use it.

When Should Wireshark Be Used?

Wireshark is a safe tool used by government agencies, educational institutions, corporations, small businesses and nonprofits alike to troubleshoot network issues. Additionally, Wireshark can be used as a learning tool.

Those new to information security can use Wireshark as a tool to understand network traffic analysis, how communication takes place when particular protocols are involved and where it goes wrong when certain issues occur.

Of course, Wireshark can’t do everything.

First of all, it can’t help a user who has little understanding of network protocols. No tool, no matter how cool, replaces knowledge very well. In other words, to properly use Wireshark, you need to learn exactly how a network operates. That means, you need to understand things such as the three-way TCP handshake and various protocols, including TCP, UDP, DHCP and ICMP.

Second, Wireshark can’t grab traffic from all of the other systems on the network under normal circumstances. On modern networks that use devices called switches, Wireshark (or any other standard packet-capturing tool) can only sniff traffic between your local computer and the remote system it is talking to.

Third, while Wireshark can show malformed packets and apply color coding, it doesn’t have actual alerts; Wireshark isn’t an intrusion detection system (IDS).

Fourth, Wireshark can’t help with decryption with regards to encrypted traffic.

And finally, it is quite easy to spoof  IPv4 packets. Wireshark can’t really tell you if a particular IP address it finds in a captured packet is a real one or not. That requires a bit more know-how on the part of an IT pro, as well as additional software.

Common Wireshark Use Cases

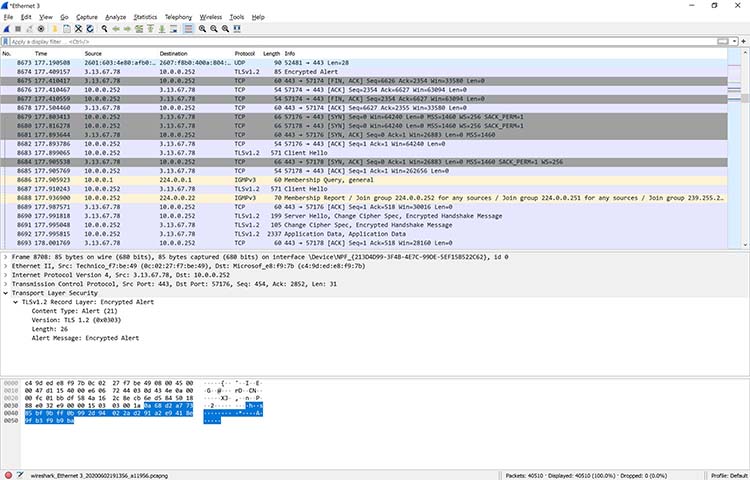
Here’s a common example of how a Wireshark capture can assist in identifying a problem. The figure below shows an issue on a home network, where the internet connection was very slow.

As the figure shows, the router thought a common destination was unreachable. This was discovered by drilling down into the IPv6 Internet Message Control Protocol (ICMP) traffic, which is marked in black. In Wireshark, any packet marked in black is considered to reflect some sort of issue.

A screenshot showing how to drill down into a packet to identify a network problem using Wireshark

Figure 2: Drilling down into a packet to identify a network problem using Wireshark

In this case, Wireshark helped determine that the router wasn’t working properly and couldn’t find YouTube very easily. The problem was resolved by restarting the cable modem. Of course, while this particular problem didn’t necessitate using Wireshark, it’s kind of cool to authoritatively finalize the issue.

When you take another look at the bottom of Figure 2, you can see that a specific packet is highlighted. This shows the innards of a TCP packet that is part of a transport layer security (TLS) conversation. This is a great example of how you can drill down into the captured packet.

Using Wireshark doesn’t allow you to read the encrypted contents of the packet, but you can identify the version of TLS the browser and YouTube are using to encrypt things. Interestingly enough, the encryption shifted to TLS version 1.2 during the listening.

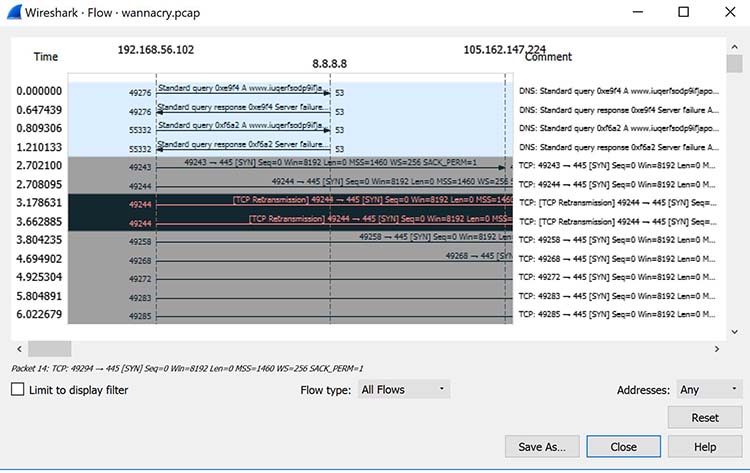
Wireshark is often used to identify more complex network issues. For example, if a network experiences too many retransmissions, congestion can occur. By using Wireshark, you can identify specific retransmission issues, as shown below in Figure 3.
A screenshot showing how to view packet flow statistics in Wireshark

Figure 3: Viewing packet flow statistics using Wireshark to identify retransmissions

By confirming this type of issue, you can then reconfigure the router or switch to speed up traffic.

How to Use Wireshark

You can download Wireshark for free at www.wireshark.org. It’s also freely available, as an open source application under the GNU General Public License version 2.

How to Install Wireshark on Windows

If you’re a Windows operating system user, download the version appropriate for your particular version. If you use Windows 10, for example, you’d grab the 64-bit Windows installer and follow the wizard to install. To install, you’ll need administrator permissions.

How to Install Wireshark on Linux

If you have a Linux system, you’d install Wireshark using the following sequence (notice that you’ll need to have root permissions):

$ sudo apt-get install wireshark

$ sudo dpkg-reconfigure wireshark-common

$ sudo usermod -a -G wireshark $USER

$ newgrp wireshark

Once you have completed the above steps, you then log out and log back in, and then start Wireshark:

$ wireshark &

How to Capture Packets Using Wireshark

Once you’ve installed Wireshark, you can start grabbing network traffic. But remember: To capture any packets, you need to have proper permissions on your computer to put Wireshark into promiscuous mode.

    • In a Windows system, this usually means you have administrator access.
    • In a Linux system, it usually means that you have root access.

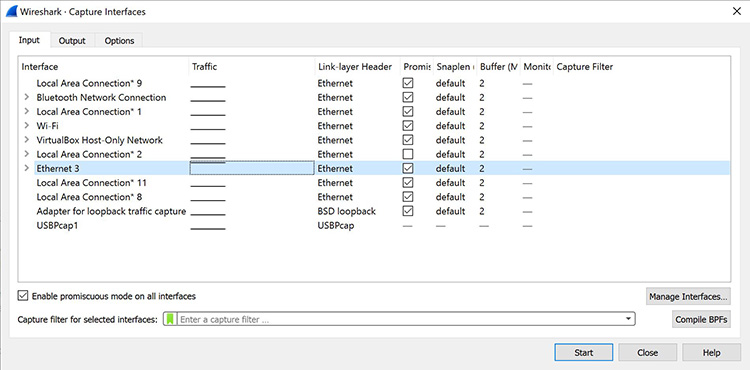
    As long as you have the right permissions, you have several options to actually start the capture. Perhaps the best is to select Capture >> Options from the main window. This will bring up the Capture Interfaces window, as shown below in Figure 4.

    A screenshot showing capture interfaces dialog in Wireshark

    Figure 4: The Capture Interfaces dialog in Wireshark

    This window will list all available interfaces. In this case, Wireshark provides several to choose from.

    For this example, we’ll select the Ethernet 3 interface, which is the most active interface. Wireshark visualizes the traffic by showing a moving line, which represents the packets on the network.

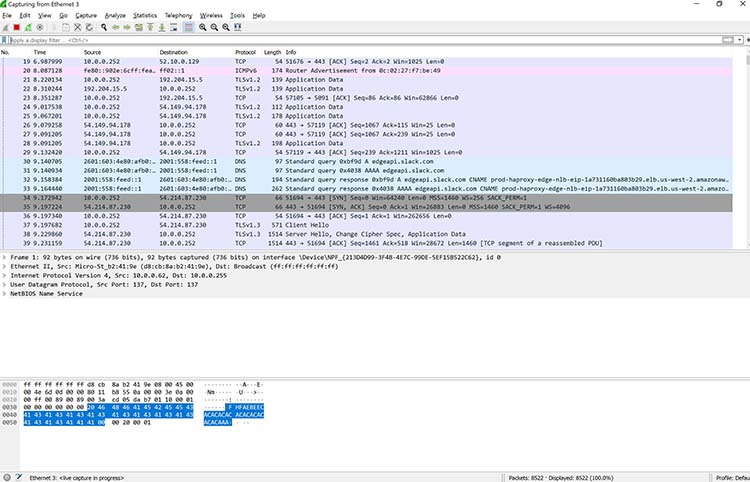
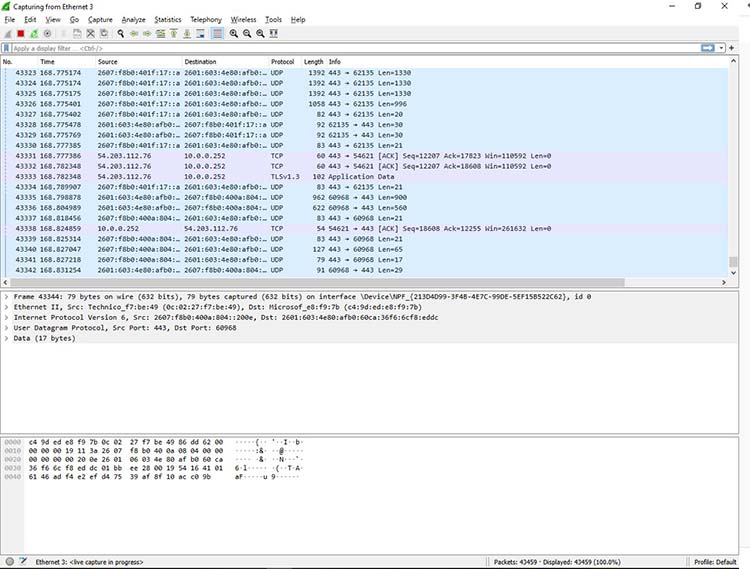
    Once the network interface is selected, you simply click the Start button to begin your capture. As the capture begins, it’s possible to view the packets that appear on the screen, as shown in Figure 5, below.

    A screenshot showing Wireshark capturing packets

    Figure 5: Wireshark capturing packets

    Once you have captured all the packets that you want, simply click the red, square button at the top. Now you have a static packet capture to investigate.

    What the Color Coding Means in Wireshark

    Now that you have some packets, it’s time to figure out what they mean. Wireshark tries to help you identify packet types by applying common-sense color coding. The table below describes the default colors given to major packet types.

    Color in Wireshark

    Packet Type

    Light purple

    TCP

    Light blue

    UDP

    Black

    Packets with errors

    Light green

    HTTP traffic

    Light yellow

    Windows-specific traffic, including Server Message Blocks (SMB) and NetBIOS

    Dark yellow

    Routing

    Dark gray

    TCP SYN, FIN and ACK traffic


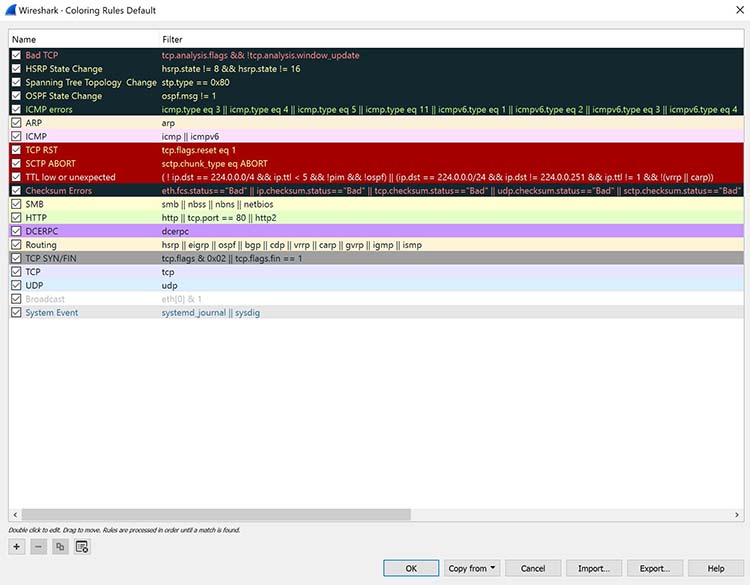
    The default coloring scheme is shown below in Figure 6. You can view this by going to View >> Coloring Rules.

    A screenshot showing the default coloring rules in Wireshark.

    Figure 6: Default coloring rules

    You can even change the defaults or apply a custom rule. If you don’t want any coloring at all, go to View, then click Colorize Packet List. It’s a toggle, so if you want the coloring back, simply go back and click Colorize Packet List again. It’s possible, even, to colorize specific conversations between computers.

    In Figure 7 below, you can see standard UDP (light blue), TCP (light purple), TCP handshake (dark gray) and routing traffic (yellow).

    A screenshot showing colorized packets in Wireshark.

    Figure 7: Viewing colorized packets in Wireshark

    However, you’re not limited to just interpreting by color. It’s possible to view the input/output (I/O) statistics of an entire packet capture.

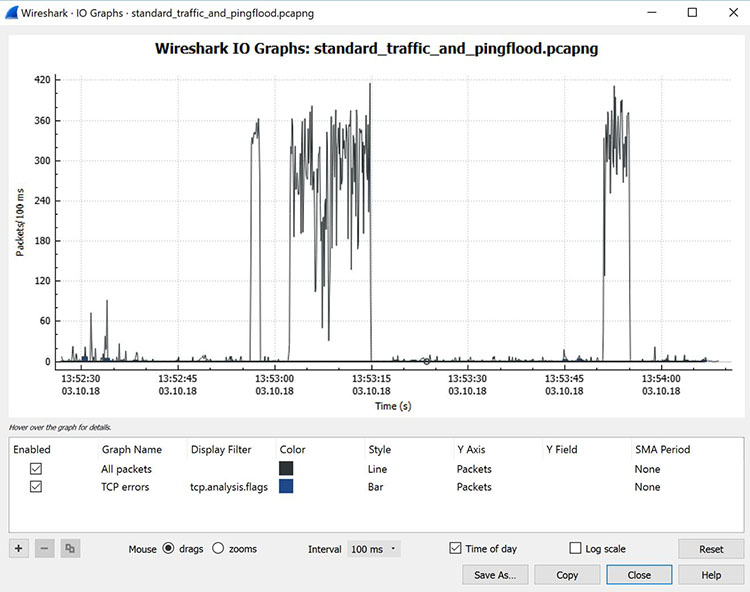
    In Wireshark, just go to Statistics >> I/O Graph, and you’ll see a graph similar to the one shown in Figure 8.

    A screenshot showing a graph of input/output traffic in Wireshark.

    Figure 8: Viewing the input/output traffic graph in Wireshark

    This particular graph is showing typical traffic generated by a home office. The spikes in the graph are bursts of traffic that were caused by generating a Distributed Denial of Service (DDoS) attack using a few Linux systems.

    In this case, three major traffic bursts were generated. Many times, cybersecurity pros use Wireshark as a quick and dirty way to identify traffic bursts during attacks.

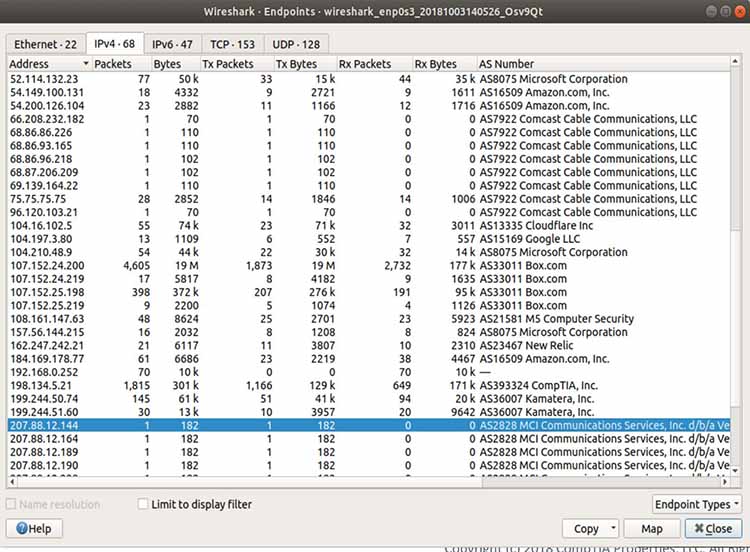
    It’s also possible to capture the amount of traffic generated between one system and another. If you go to Statistics and then select Conversations, you will see a summary of conversations between end points, as shown below in Figure 9.

    A screenshot showing endpoint conversations in Wireshark.

    Figure 9: Viewing endpoint conversations in Wireshark

    In the above case, Wireshark was used to see if an old piece of equipment from MCI communications that was running on a client’s network could be traced.

    It turned out that the client didn’t know this device was even on the network. Thus, it was removed, helping to make the network a bit more secure. Notice, also, that this network connection is experiencing a lot of traffic to Amazon (administering a server in AWS at the time) and Box.com (using Box for system backup at the time).

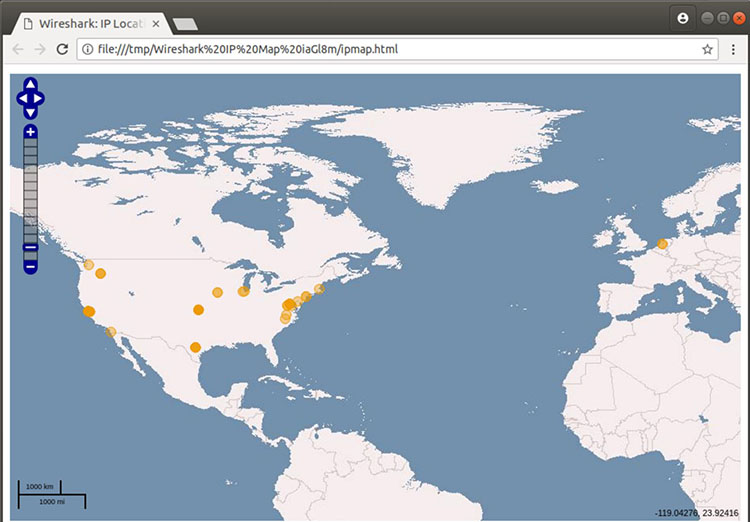
    In some cases, it is even possible to use Wireshark to identify the geographic location of source and destination traffic. If you click on the Map button at the bottom of the screen (shown in Figure 9 above), Wireshark will show you a map (Figure 10), providing its best guess of the location of the IP addresses you’ve identified.

    A screenshot showing geographic estimations in Wireshark.

    Figure 10: Viewing geographic estimations in Wireshark

    Because IPv4 addresses can be easily spoofed, you can’t rely completely on this geographical information. But it can be fairly accurate.

    How to Filter and Inspect Packets in Wireshark

    You can apply Wireshark filters in two ways:

    1. In the Display Filter window, at the top of the screen
    2. By highlighting a packet (or a portion of a packet) and right-clicking on the packet

    Wireshark filters use key phrases, such as the following:

    ip.addr

    Specifies an IPv4 address

    ipv6.addr

    Specifies an IPv6 address

    src

    Source - where the packet came from

    dst

    Destination - where the packet is going

    You can also use the following values:

    &&

    Means “and,” as in, “Choose the IP address of 192.168.2.1 and 192.168.2.2”

    ==

    Means “equals,” as in “Choose only IP address 192.168.2.1”

    !

    Means “not,” as in, do not show a particular IP address or source port


    Valid filter rules are always colored green. If you make a mistake on a filter rule, the box will turn a vivid pink.

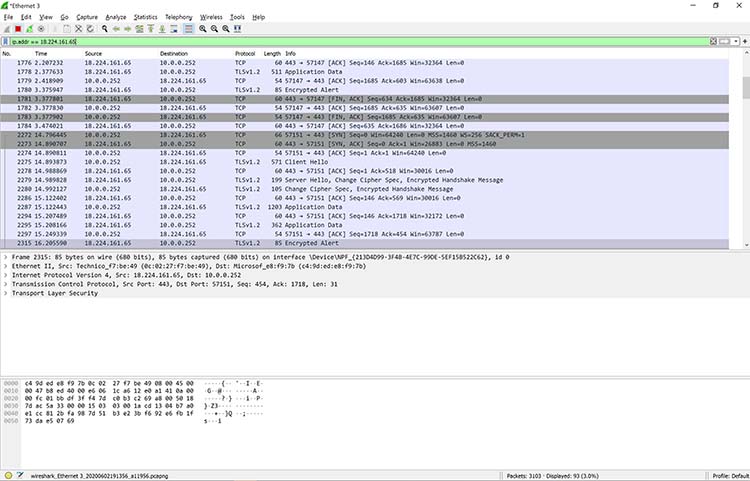
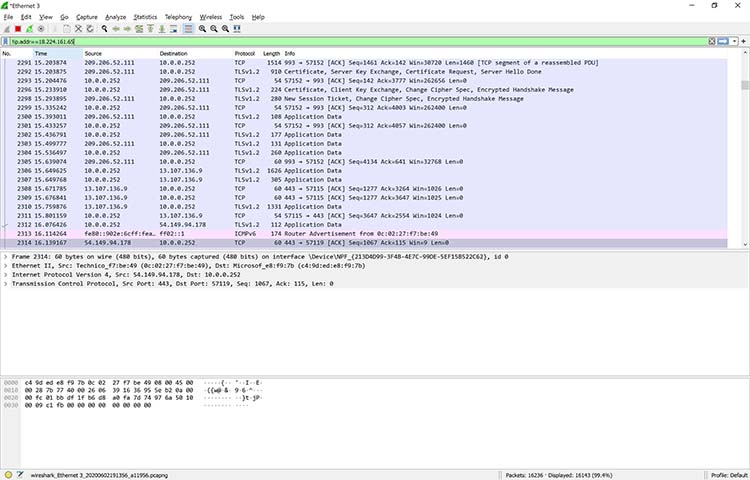
    Let’s start with a couple of basic rules. For example, let’s say you want to see packets that have only the IP address of 18.224.161.65 somewhere inside. You would create the following command line, and put it into the Filter window:

    ip.addr == 18.224.161.65 

    Figure 11 shows the results of adding that filter:

    A screenshot showing a filter applied to a capture in Wireshark

    Figure 11: Applying a filter to a capture in Wireshark

    Alternatively, you can highlight the IP address of a packet and then create a filter for it. Once you select the IP address, right-click, and then select the Apply As Filter option.

    You’ll then see a menu of additional options. One of those is called Selected. If you choose Selected, then Wireshark will create a filter that shows only packets with that IP address in it.

    You can also decide to filter out a specific IP address using the following filter, also shown in Figure 12:

    !ip.addr==18.224.161.65 

    A screenshot showing how to filter a specific IP address  in Wireshark

    Figure 12: Filtering out a specific IP address in Wireshark

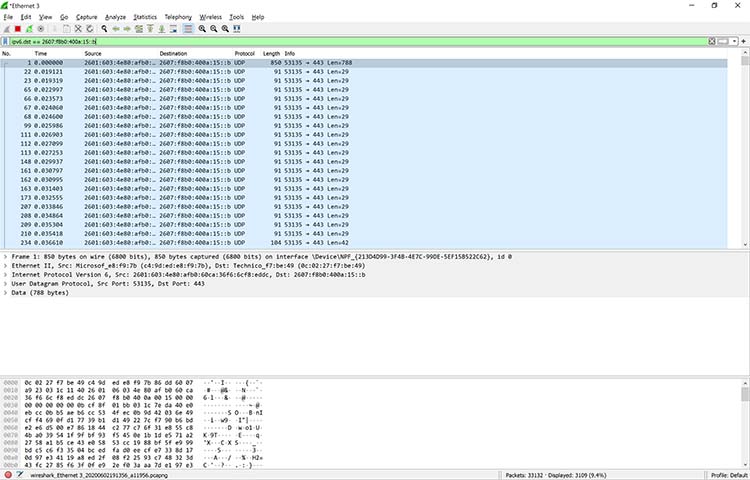
    You’re not limited to just IPv4 addresses. For example, if you want to see if a particular computer is active and using an IPv6 address on your network, you can open up a copy of Wireshark and apply the following rule:

    ipv6.dst == 2607:f8b0:400a:15::b 

    This same rule is shown in Figure 13.

    A screenshot showing an IPv6 filter in Wireshark

    Figure 13: Applying an IPv6 filter in Wireshark

    Clearly, this system is alive and well, talking on the network. There are so many possibilities.

    Additional filters include:

    tcp.port==8080

    Filters packets to show a port of your own choosing – in this case, port 8080

    !(ip.src == 162.248.16.53)

    Shows all packets except those originating from 162.248.16.53

    !(ipv6.dst ==

    2607:f8b0:400a:15::b)

    Shows all packets except those going to the IPv6 address of 2607:f8b0:400a:15::b

    ip.addr == 192.168.4.1 &&

    ip.addr == 192.168.4.2

    Shows both 192.168.4.1 and 192.168.4.2

    http.request

    Shows only http requests – useful when troubleshooting or visualizing web traffic


    As you can see, Wireshark is a powerful application.

Next Post Previous Post
No Comment
Add Comment
comment url